Accuracy Assessment
Accuracy Assessment Tools
Accuracy assessment methods can produce statistical outputs to check the quality of the classification results. Tables from statistical assessments can be saved as .txt files, while graphical results can be exported in raster format.
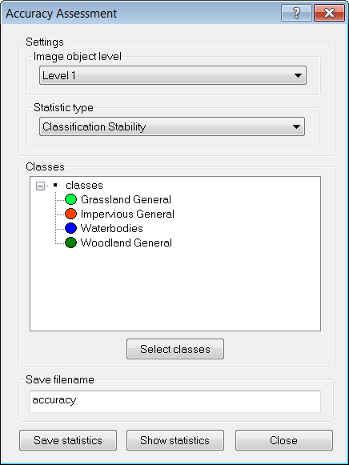
- Choose Tools > Accuracy Assessment on the menu bar to open the Accuracy Assessment dialog box
- A project can contain different classifications on different image object levels. Specify the image object level of interest by using the Image object level drop-down menu. In the Classes window, all classes and their inheritance structures are displayed.
- To select classes for assessment, click the Select Classes button and make a new selection in the Select Classes for Statistic dialog box. By default all available classes are selected. You can deselect classes through a double-click in the right frame.
- In the Statistic type drop-down list, select one of the following methods for accuracy assessment:
- Classification Stability
- Best Classification Result
- Error Matrix based on TTA Mask
- Error Matrix based on Samples
- To view the accuracy assessment results, click Show statistics. To export the statistical output, click Save statistics. You can enter a file name of your choice in the Save filename text field. The table is saved in comma-separated ASCII .txt format; the extension .txt is attached automatically.
Classification Stability
The Classification Stability dialog box displays a statistic type used for accuracy assessment.
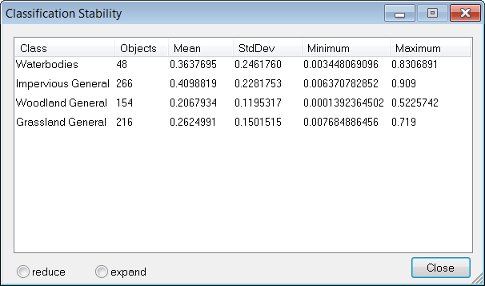
The difference between the best and the second best class assignment is calculated as a percentage. The statistical output displays basic statistical operations (number of image objects, mean, standard deviation, minimum value and maximum value) performed on the best-to-second values per class.
The Best Classification Result dialog box displays a statistic type used for accuracy assessment.
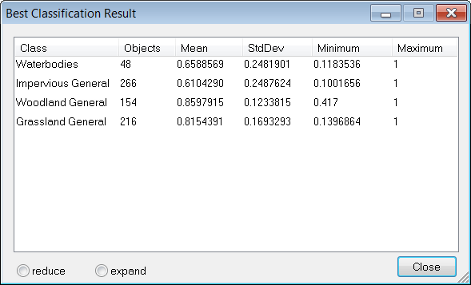
The statistical output for the best classification result is evaluated per class. To display the graphical output, go to the View Settings Window and select Mode > Best Classification Result. Basic statistical operations are performed on the best classification result of the image objects assigned to a class (number of image objects, mean, standard deviation, minimum value and maximum value).
Error Matrices
The Error Matrix Based on TTA Mask dialog box displays a statistic type used for accuracy assessment.
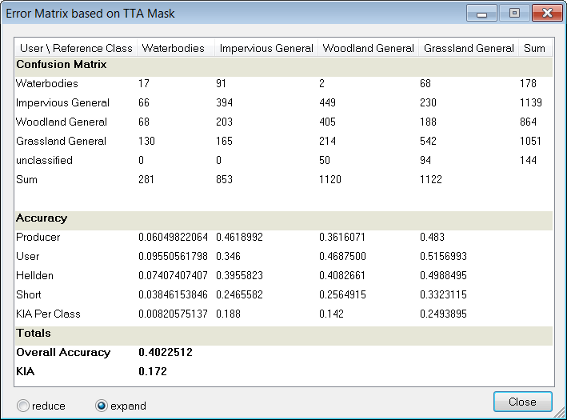
Test areas are used as a reference to check classification quality by comparing the classification with reference values (called ground truth in geographic and satellite imaging) based on pixels.
The Error Matrix Based on Samples dialog box displays a statistic type used for accuracy assessment.
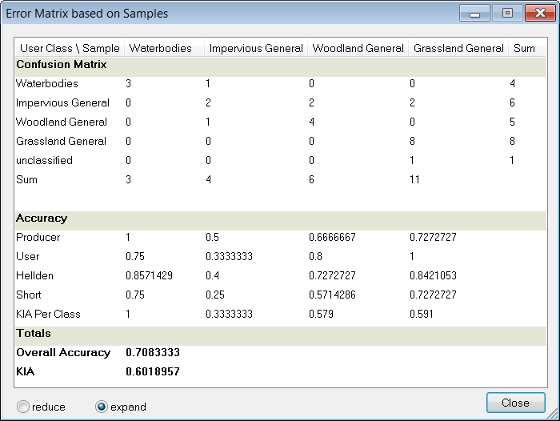
This is similar to Error Matrix Based on TTA Mask but considers samples (not pixels) derived from manual sample inputs. The match between the sample objects and the classification is expressed in terms of parts of class samples.
